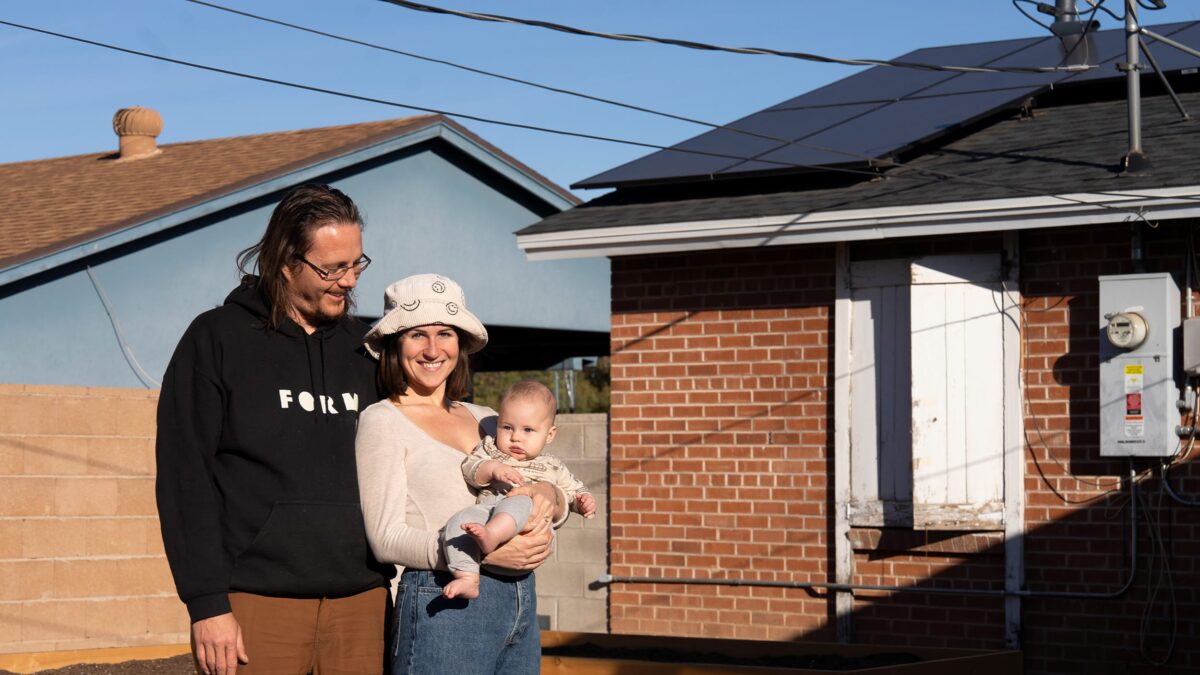
Energy freedom starts with solar.
We help people go solar and fight for their energy rights.

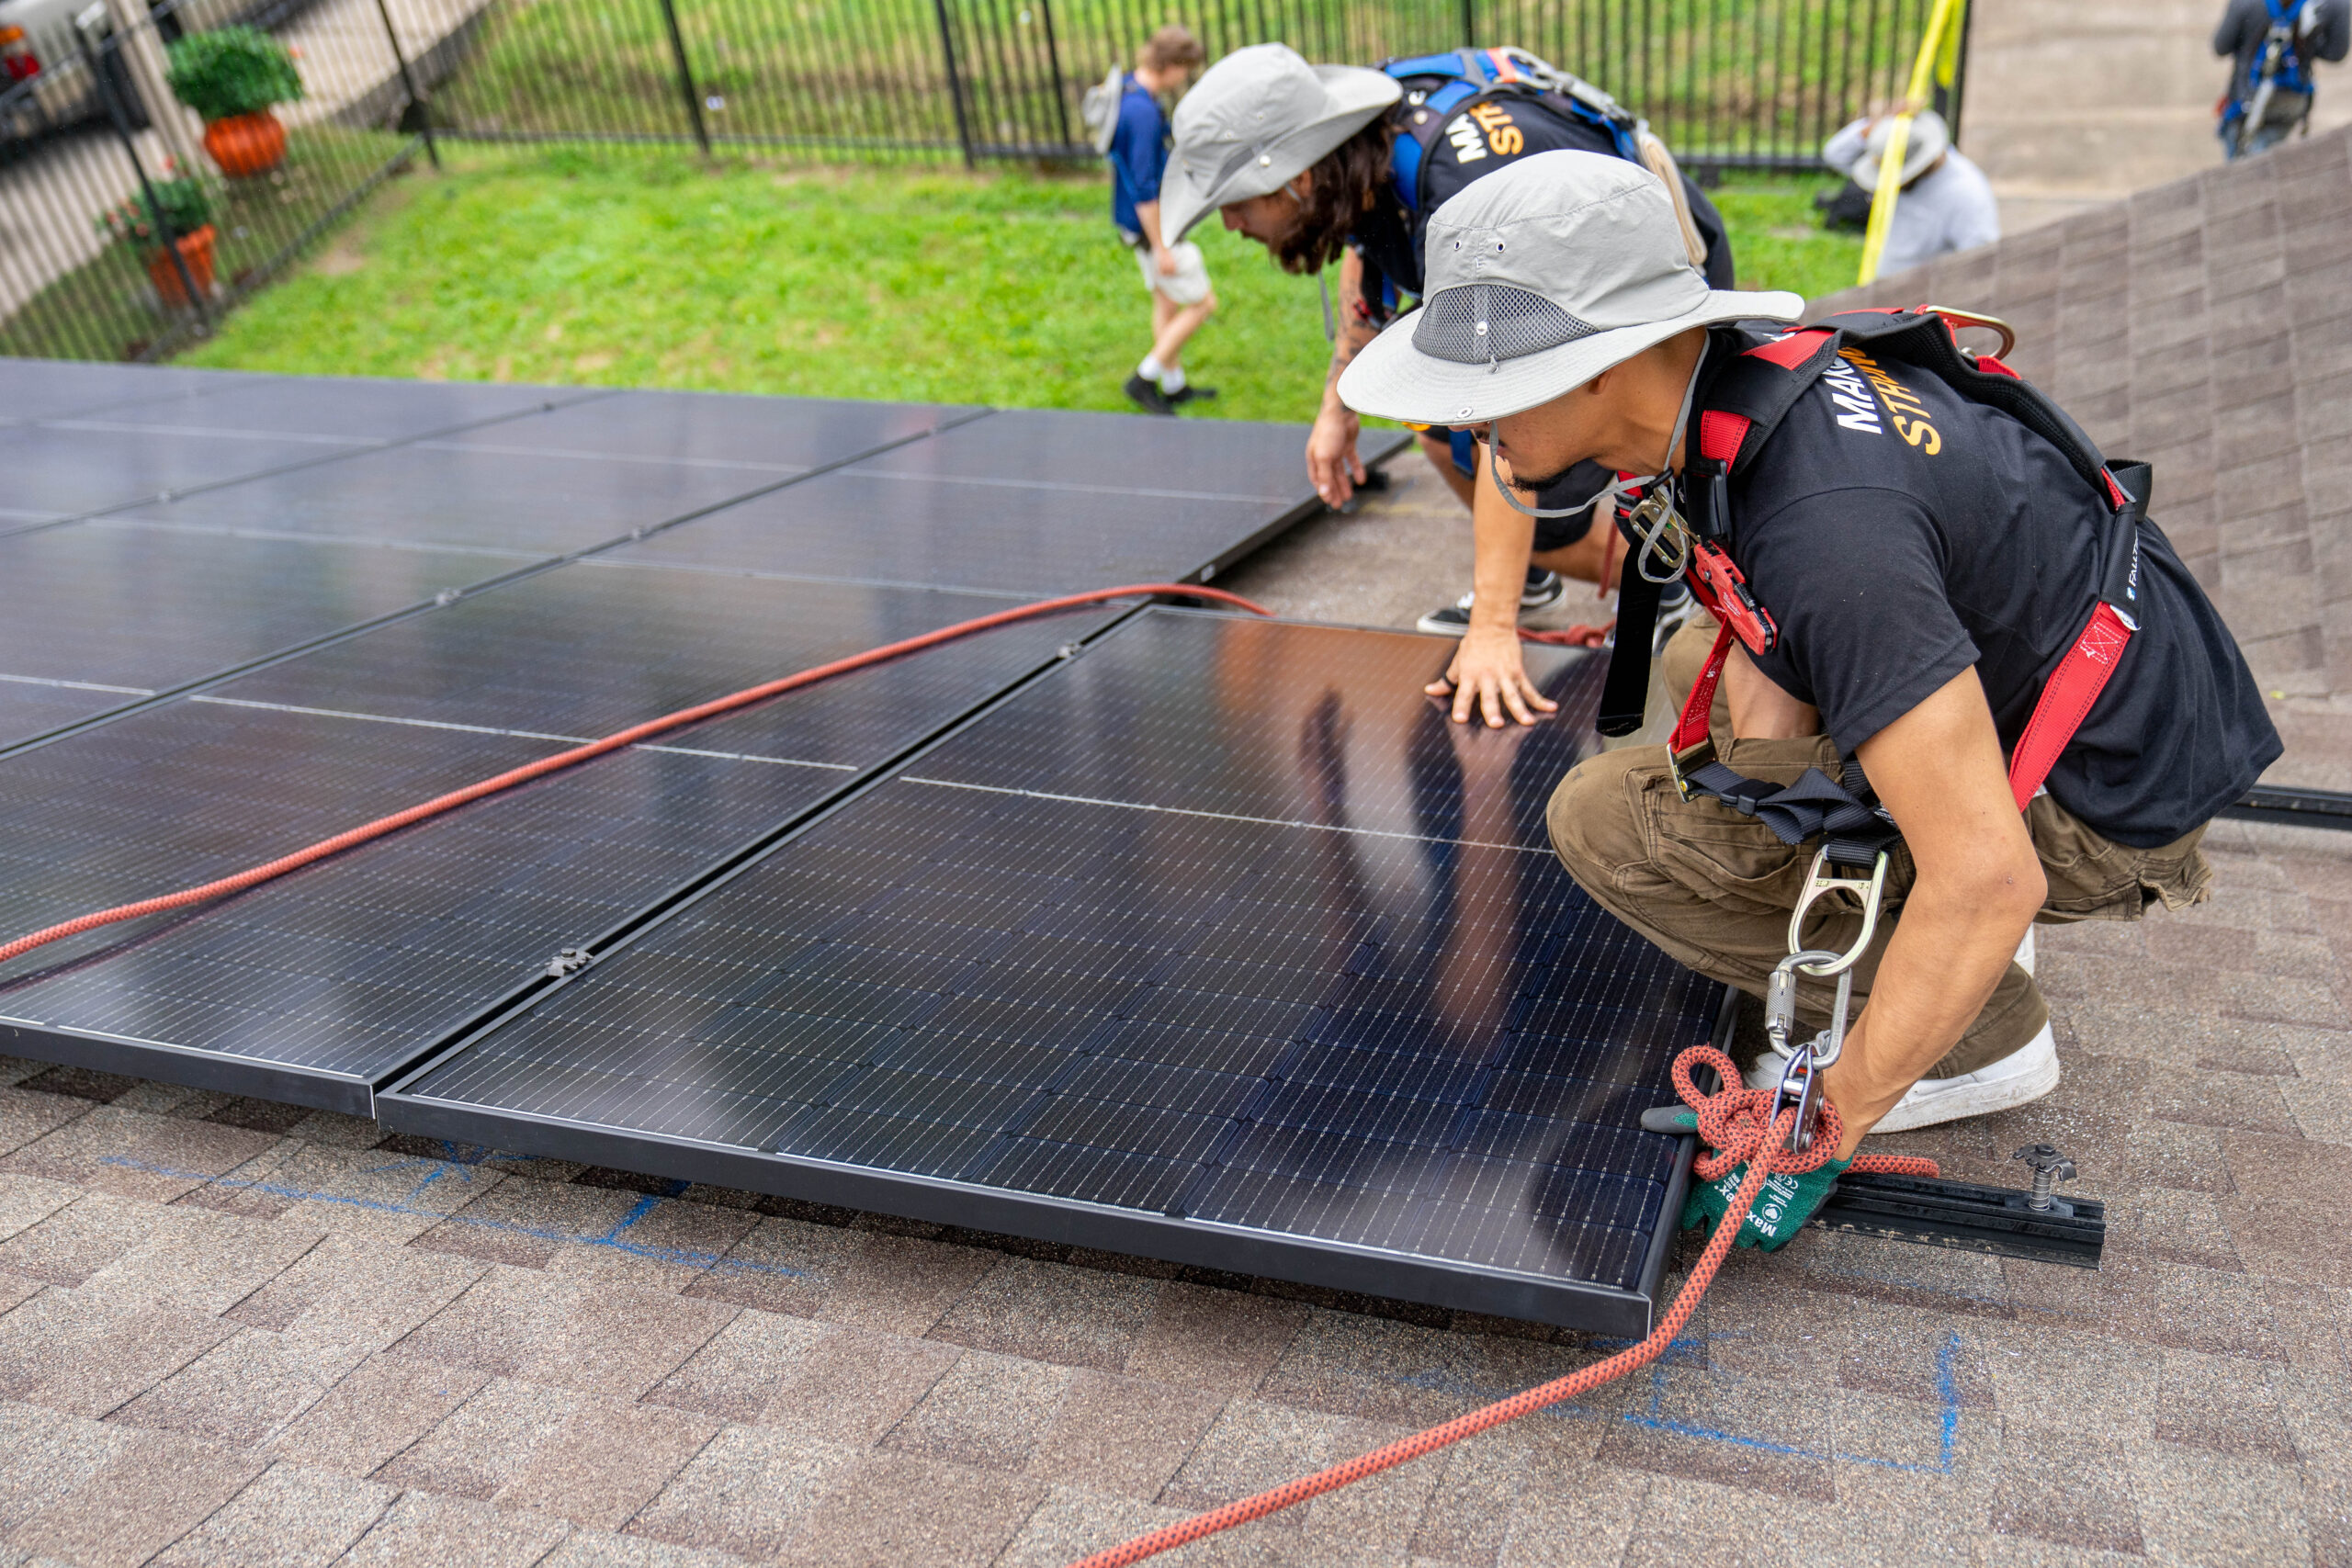
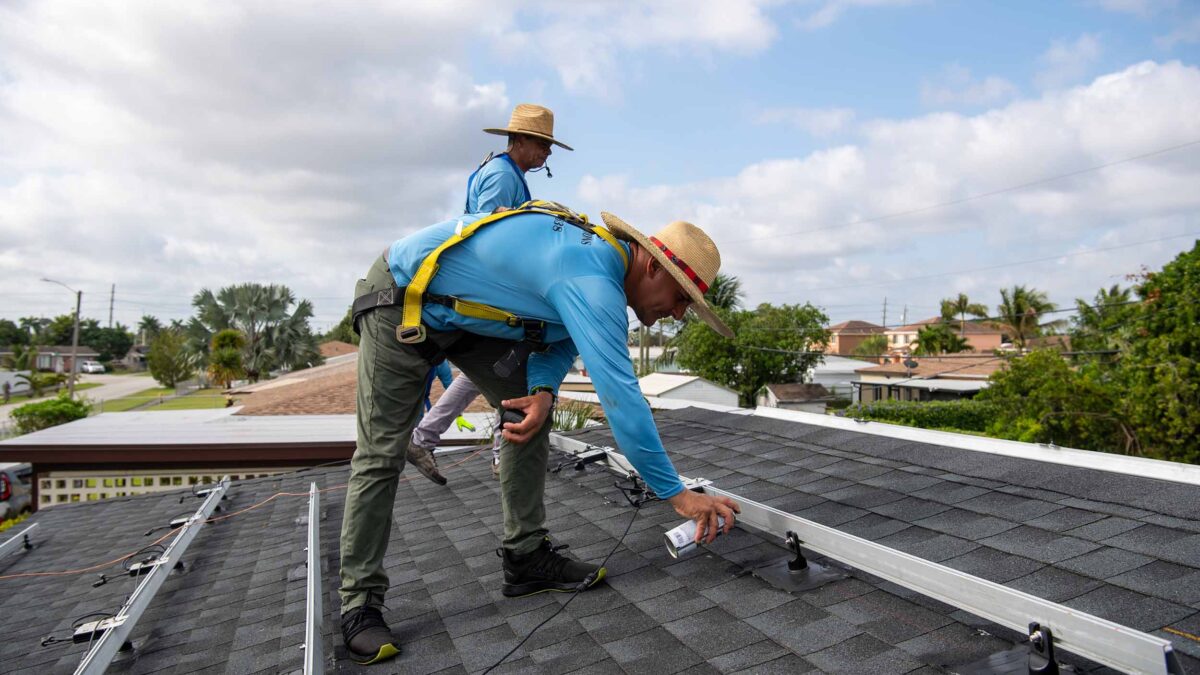
Help at every step
Solar FAQ
Solar Renewable Energy Credits (SRECs)

How to spot solar panel scams
How to address problems with your solar installer
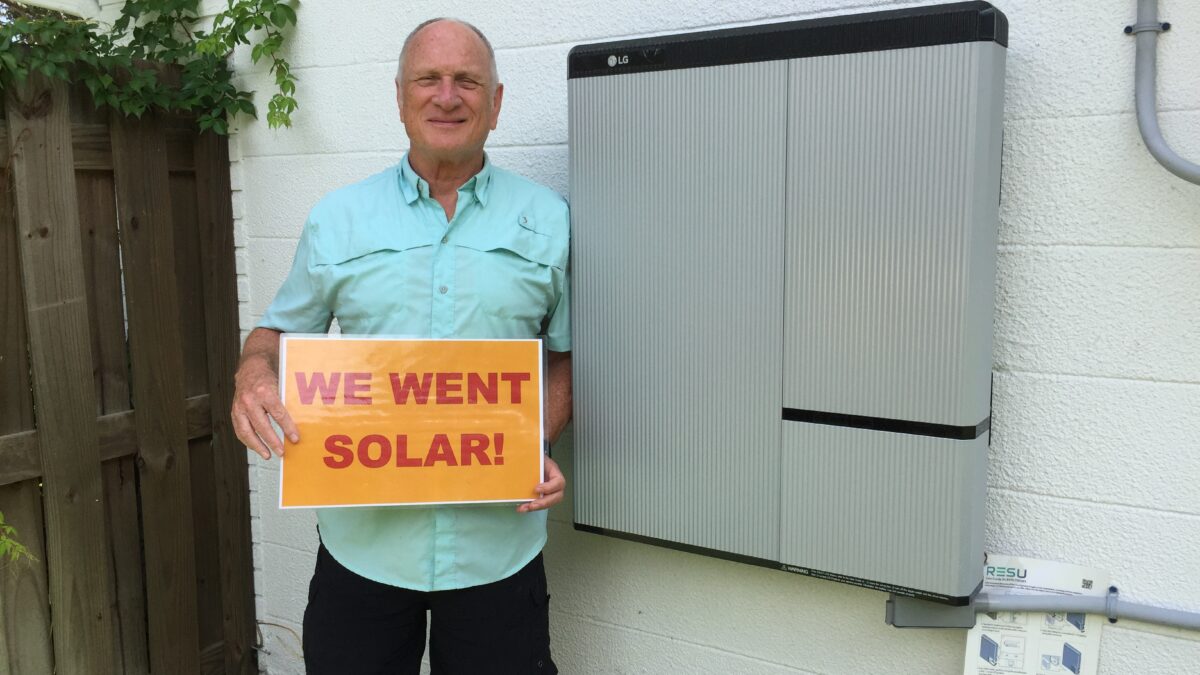
Solar and storage: an ideal pair
Get involved
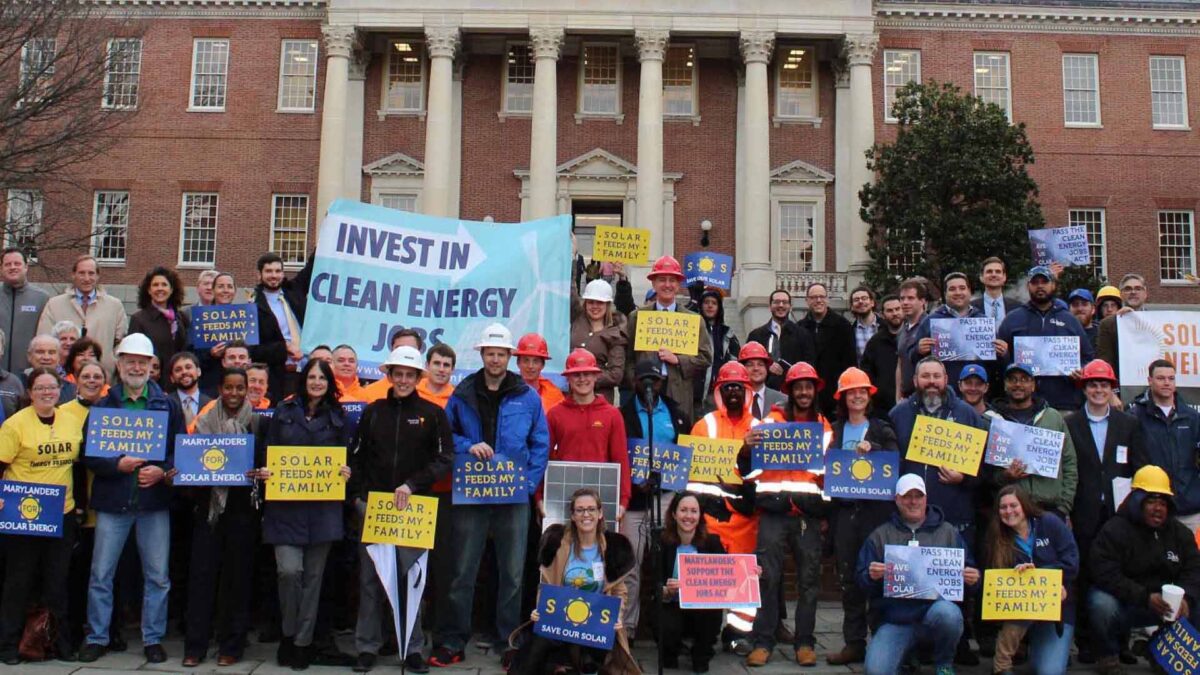
Partner with us
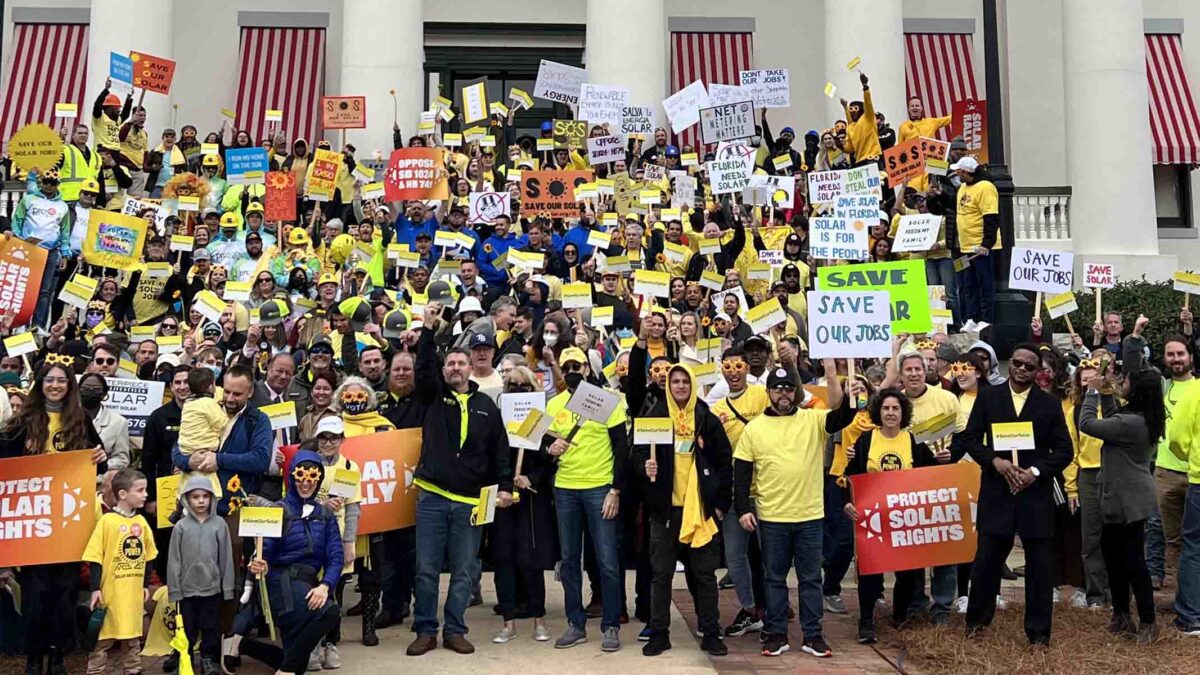
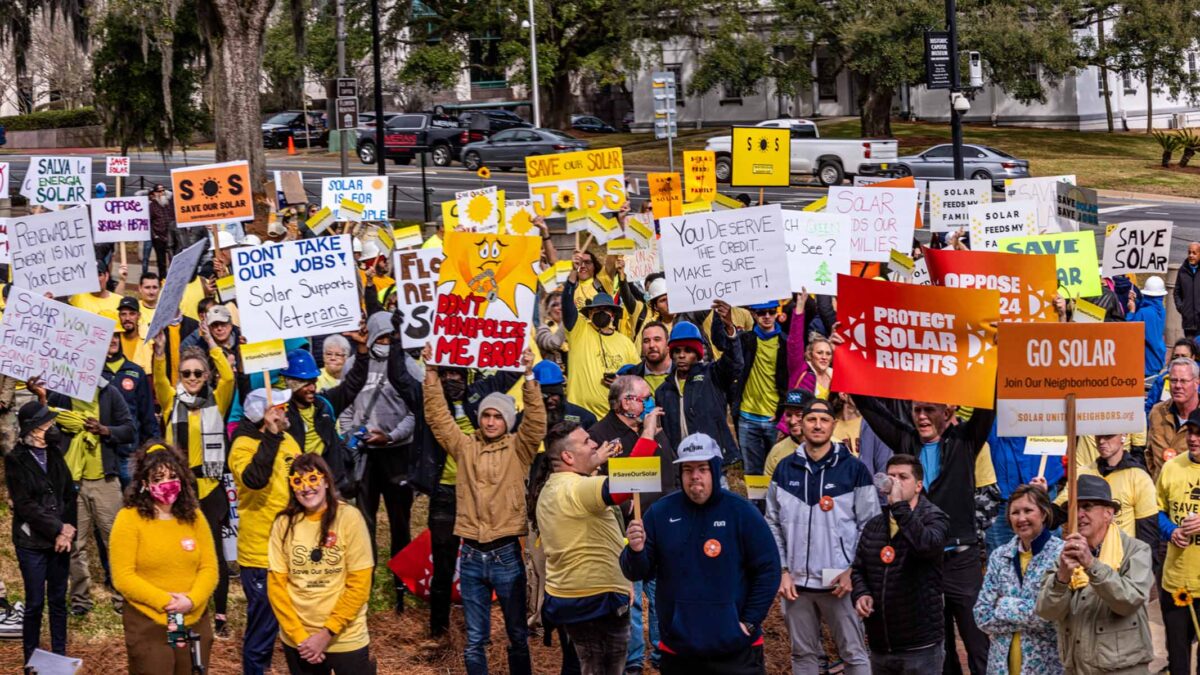
National Solar Activist Network

Take action
Take action
Solar Advocate Citizen Lobbying Guide
HOA Solar Action Guide
Don’t see what you’re looking for?
Tell Congress to protect solar investments
Volunteer with Solar United Neighbors
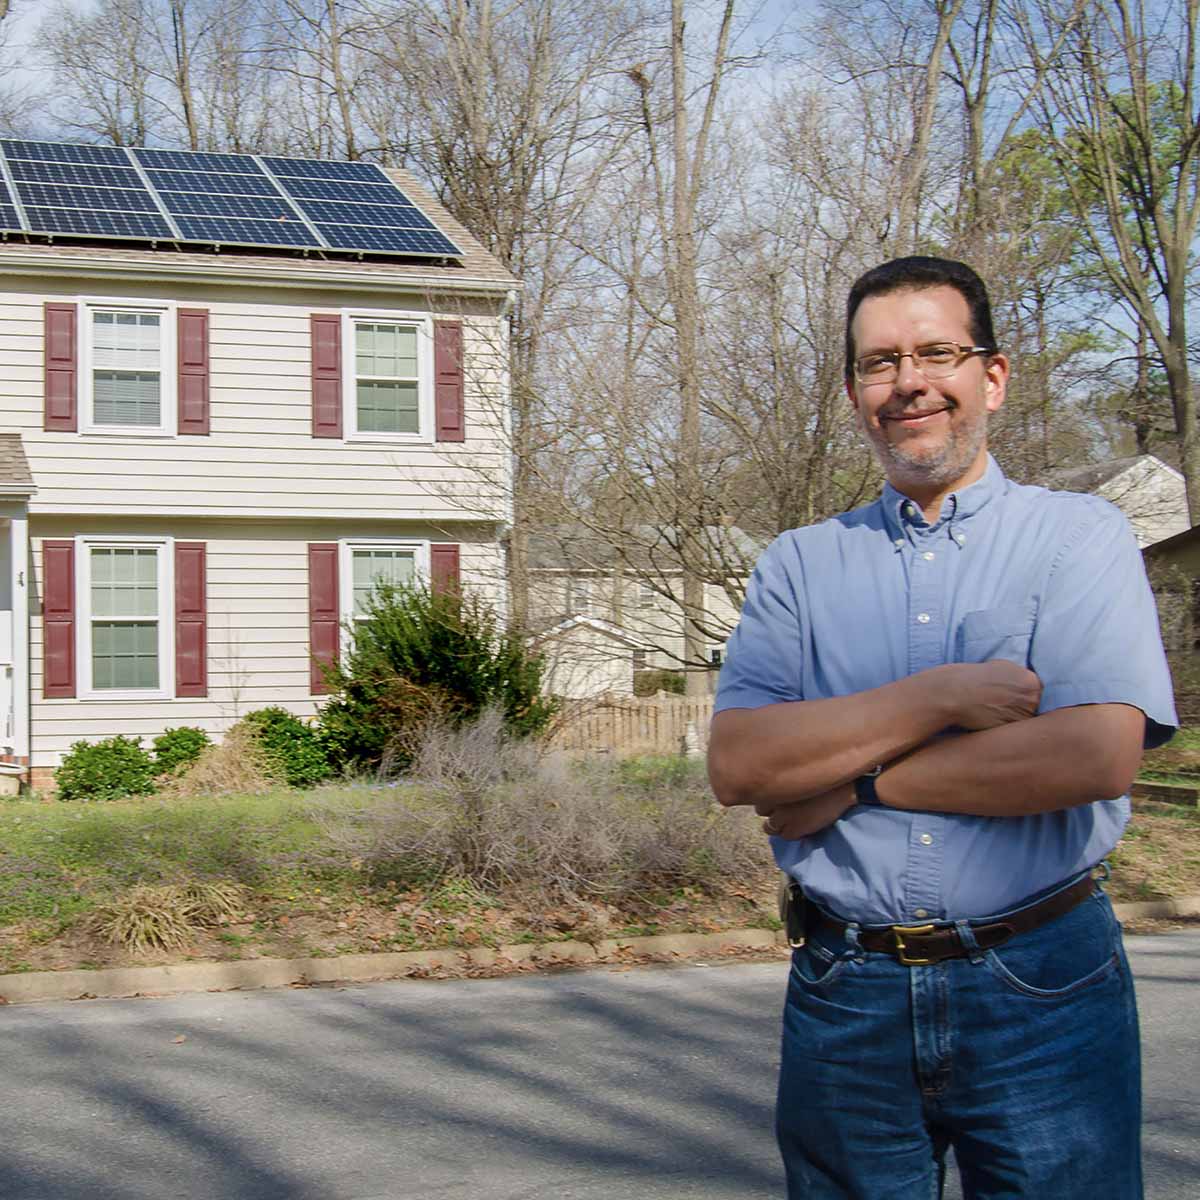
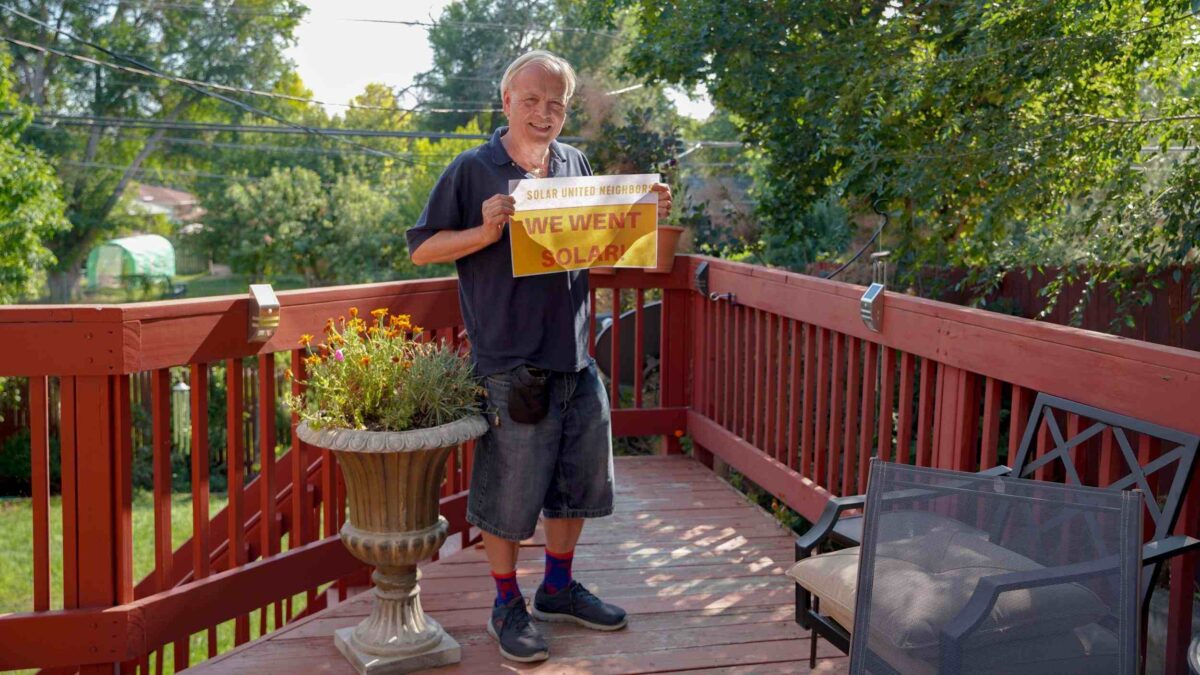
The co-op… allowed us to get a really good price with an excellent installer.
Richmond Solar Co-op